
INFOGRAPHICS
|
A visual can be a faster way to communicate a concept or relay data analysis. Whether creating a design from scratch or using Tableau for a data visualization, we ensure that the story is meaningful and engaging.
|
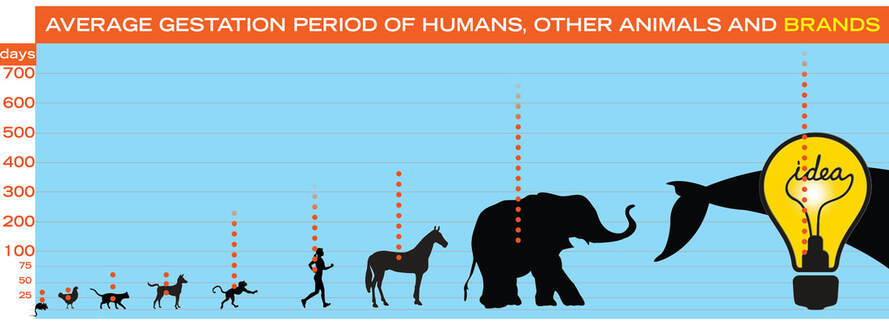
Playful representation of the time it takes to develop a brand.
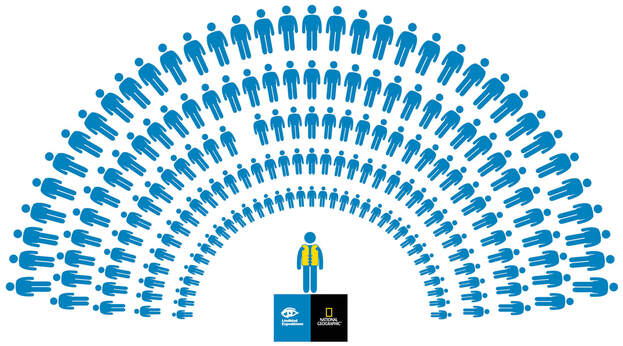
One customer sharing their Lindblad Expeditions experience
can have a far reaching viral marketing impact
can have a far reaching viral marketing impact
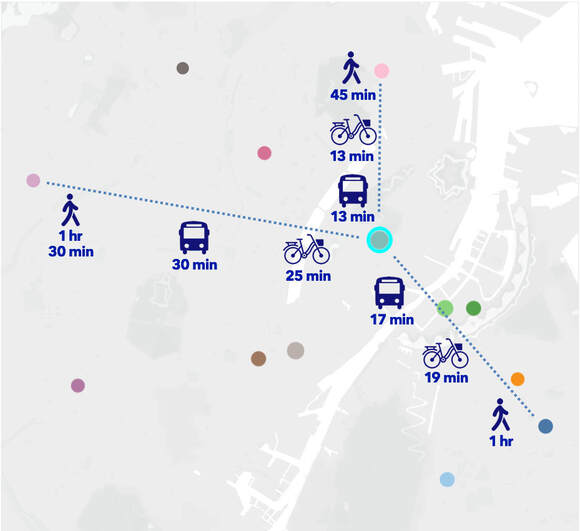
Commuting time from Copenhagen districts to the City Center
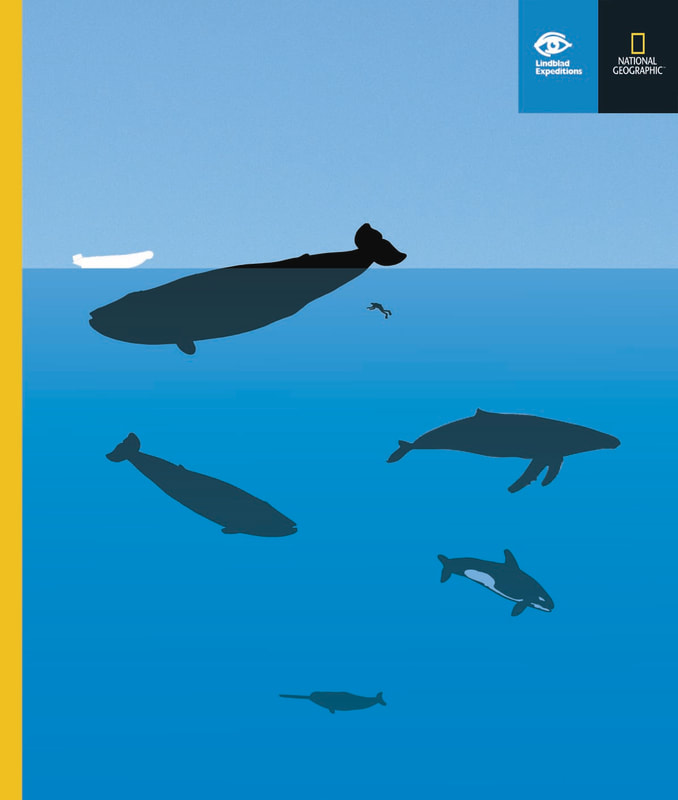
Size comparison of wildlife experienced on a Lindblad Expeditions adventure
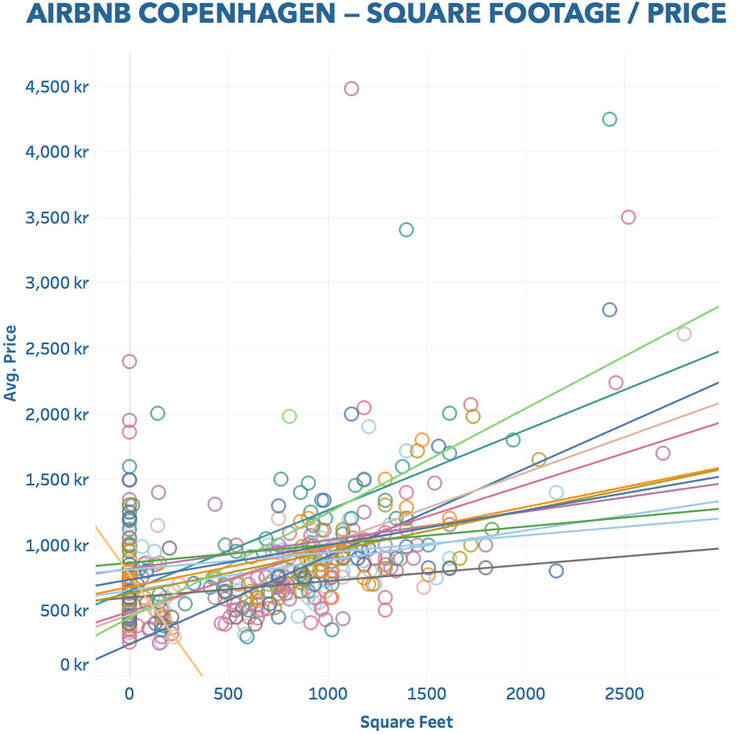
Average price of Copenhagen Airbnb compared to square footage
Data visualization created in Tableau
Data visualization created in Tableau